California EV Stations Spatial Analysis
Introduction & Methodology
In further refining our analysis, we will look at EV charging stations in the state of California. The data is taken from the U.S. Department of Energy, where we further filtered down the dataset to California, and where the fuel type electric.
After importing and refining our station and city data, we then merge the EV station data with the cities and add a “count” column with a value of 1 in order to add a numeric value to the analysis.
The exploratory spatial analysis will look at: count of stations by city, count of EV level 2 charging stations, and a further look at stations in Los Angeles.
The data for the first two analyses is converted from wide to tidy, then gathered by the number of stations by city. This data is merged with a prior dataset to retrieve the geometry. To refrain from duplicates, we utilize idxmax() then further plot these with hvplot. The workflow for stations in Los Angeles is similar to the aforementioned process but includes the additional steps of filtering down to Los Angeles, and merging on street addresses in order to also see the number of stations by location in the city. This also includes an overlay of HUD qualifying census tracts.
Data sources:
- https://afdc.energy.gov/fuels/electricity_locations.html#/analyze?fuel=ELEC
- https://data.ca.gov/dataset/ca-geographic-boundaries
- https://geohub.lacity.org/datasets/lacounty::hud-qualified-census-tracts-2022/explore
Exploratory + Spatial Analaysis
EV Stations by California City
The following interactive map indicates the number of EV stations by California city from 1996-2022. As expected, major cities have high densities of stations including Los Angeles, San Diego, San Francisco, and San Jose. The chart also indicates that there are stations along major instates including I-5. However, it is noteable that California’s central valley has minimal stations. This may pose an issue as Californians often traverse through the Central Valley when traveling between Northern and Southern California.
EV Level 2 Stations in California
Level 2 stations are the fastest EV charging stations. The following interactive map indicates the amount of EV Level 2 statinos are located in each city. The result of this analysis follows a similar trend from the previous analysis.
Focusing on Los Angeles
Taking a closer look, we investigate EV stations in Los Angeles. The interactive map plots the EV stations in Los Angeles regardless of charging type and is overlayed by the qualifying census tracts (QCT) by the U.S. Department of Housing and Urban Development. As expected, many of the stations in the city are located in major hubs including downtown, UCLA, LMU, USC, and the various airports for example. The QCT component of this analysis finds that many of the charging stations are not in QCTs, meaning that it is apparent sustainable transportation is a mode geared for the wealthy. This also may lead to further discussions of folks with electric vehicles avoiding these areas due to classism and the lack of charging stations, which may pose as an issue for small business owners of these areas who rely on the transaction with wealthier individuals.
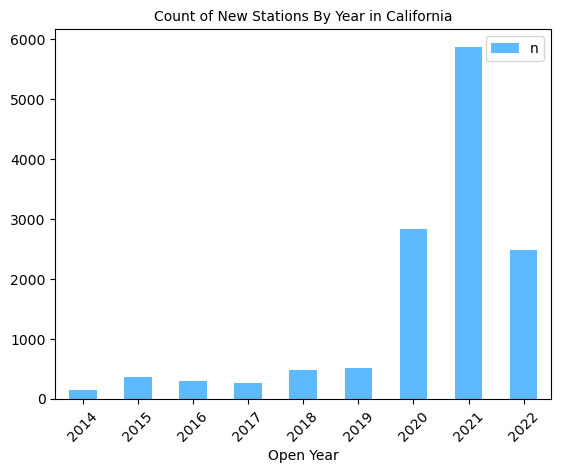
EV Stations by Year
Lastly, we look at how many EV stations opened across the state by year. 2014-2019 saw minimal growth, however there was a drastic jump in 2020 and an even greater increase in 2021. Note that the data is by the openening year, therefore the count by year is not the total number of stations by year and does not incorporate the value of the previous year but rather shows, how many new stations were added by year.
